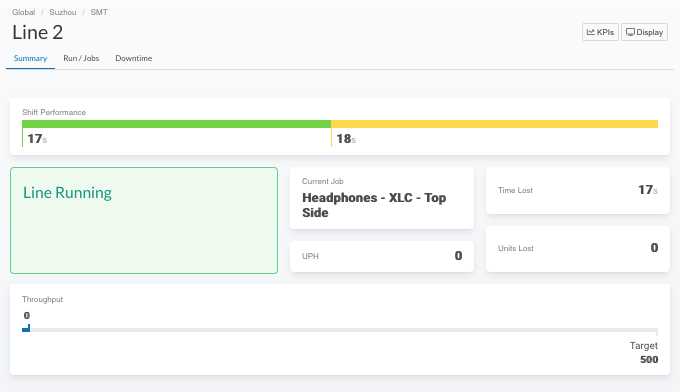
Summary: You can use the Summary tab to monitor shift performance and a job's status in ArchFX React.
While a job is running, the Summary tab is your main view for monitoring that job's status in detail. (You can see the status of all the jobs in the area at a high level on the Supervisor View.) Click the Display button in the top-right corner to open a view of the Summary tab suitable for use on an overhead display over a line; that view has Full Screen and Exit buttons.

Shift Performance bar
The "Shift Performance" bar shows the breakdown of time on the shift between running time (green), idle time (yellow), planned downtime (blue), unplanned uncategorized downtime (dark red), and unplanned categorized downtime (bright red).
The total "downtime" reported on this performance bar only includes the time consumed by automatically detected downtime events during the current shift, not by cycles that are slower than the target takt time but not slow enough to reach the downtime detection threshold. (See What's the difference between downtime and time lost? for details.)
Job Performance panels
The middle set of panels relate to the performance of the current job within the current shift:
- The Status Panel (showing "Line Running," above) shows the current status of the line. When a downtime event occurs, the panel will show an Edit button so you can label the downtime event with a reason.
- "Current Job" shows the name of the job currently being built on the line.
- "Time Lost" shows the total amount of time lost during this shift to cycles that were slower than the target takt time. This includes both time lost to automatically detected downtime events and time lost due to cycles that were slower than the target takt time but not slow enough to reach the downtime detection threshold. (See What's the difference between downtime and time lost? for details.)
- "Units Lost" converts the time lost to units of product lost by dividing time lost by the time per unit.
- "UPH" (Units Per Hour) is a moving average (over up to the last four takt times for the last five units built) of the number of units per hour the line is building at the moment. UPH will initially display zero until the second product ready event is detected and the first takt time can be calculated. The panel displays the current moving average UPH and the target UPH separated by a slash. For example, if current moving average is 50 UPH and target UPH is 60, you will see "UPH 50 / 60". If product ready events stop occurring, React will decrease the UPH estimate back to zero in a linear fashion to try to approximate reality.
Throughput Bar
The Throughput Bar on the bottom shows the progress of this job so far (Throughput) during all shifts towards the Target for the job.
- "Throughput" is the number of units built by this job so far.
- Target is the target number of units to be built in total for this job.
NOTE: If you have set up an "infinite job" by setting Target Units = 0 on the Create Job dialog, the Throughput Bar will show the number of units created so far compared to the target number of units for the current shift (since the "infinite job" might run for many months).

Comments
0 comments
Please sign in to leave a comment.