
The Cycle Time Inspection Dashboard lets manufacturing engineers efficiently identify lines needing reconfiguration and/or recipes needing rebalancing to improve a line's cycle time.
Filters
You use these filters to select which machines and programs you want to view:
- Site: Select the site you want to view.
- Line: Select the line you want to view.
- Machine: Select the machine(s) you want to view (or "All" for all machines).
- Program: Select the program(s) you want to view (or "All" for all programs).
Remember to use the date picker in the top-right corner to choose the time period you want to view.
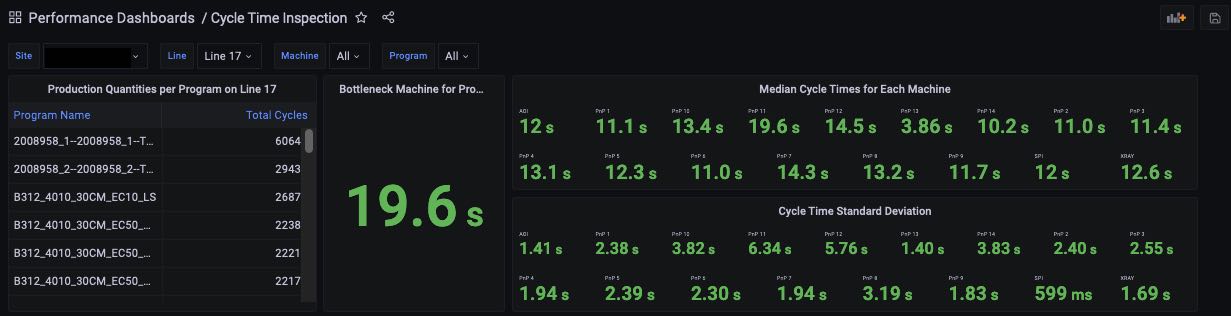
Line summary statistics
After setting your filters, for the selected site and line, you see:
- Production Quantities Per Program, which lists all programs seen during the selected time period, and for each, the number of cycles completed.
- Bottleneck Machine for Program: the cycle time of the machine that had the longest cycle time
- Median Cycle Times Time for Each Machine: for each selected machine, shows its name and the median cycle time during the period selected
- Cycle Time Standard Deviation: for each selected machine, shows the standard deviation from the median cycle time
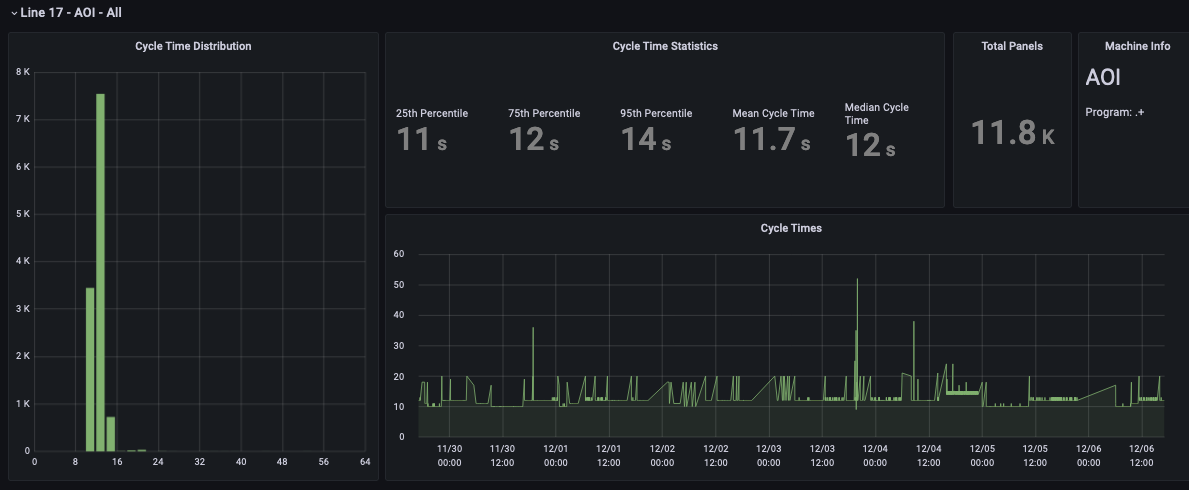
Per-machine statistics
Then, for each selected machine, the dashboard shows:
- Cycle Time Distribution: histogram showing the distribution of cycle times
- Cycle Time Statistics, which shows the 25th Percentile, 75th percentile, 95th Percentile, Mean, and Median cycle times.
- Total Panels seen during the period.
- Machine Info: clicking the machine name will take you to the Machine Program Details Dashboard with this machine and the same time period selected so you can drill down on the individual machine's performance.
- Cycle Times: a timeline charting the cycle times observed during the period. Keep in mind that a cycle time will be large if something interrupts the cycle.
Comments
0 comments
Please sign in to leave a comment.