
The Machine Program Details Dashboard lets manufacturing engineers efficiently identify programs on production lines (not New Product Introduction lines) that are performing inconsistently and need optimization to improve machine cycle time and line takt time.
Filters
You use these filters to select which machines and programs you want to view:
- Site: Select the site you want to view.
- Line: Select the line you want to view.
- Machine: Select the machine(s) you want to view (or "All" for all machines).
- Program: Select the program(s) you want to view (or "All" for all programs).
Remember to use the date picker in the top-right corner to choose the time period you want to view.
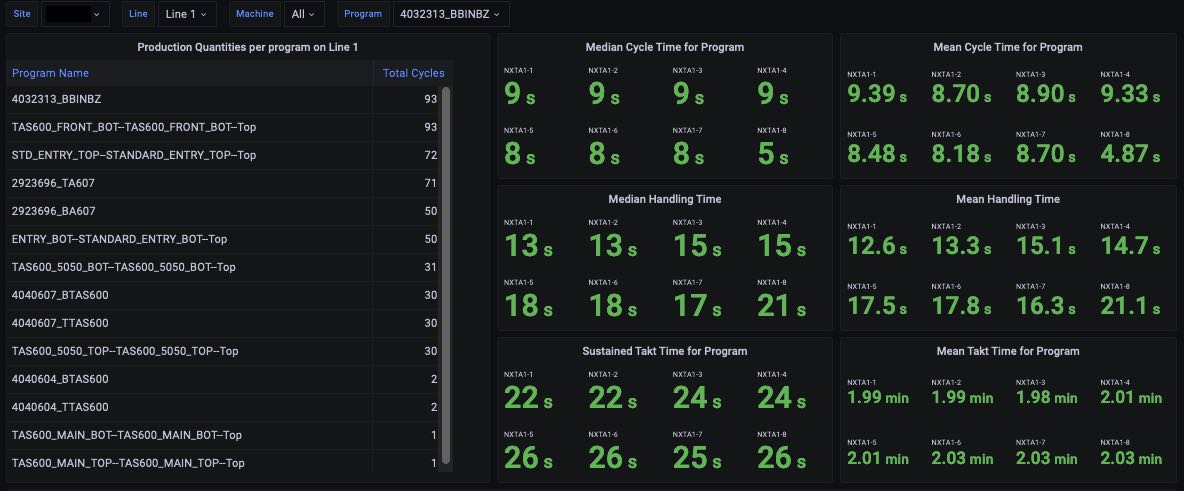
Program summary statistics
After setting your filters, for the selected site, line, machine(s), and program(s), you see:
- Production Quantities Per Program, which lists all programs seen during the selected time period, and for each, the number of cycles completed.
- Median Cycle Time for Program
- Mean Cycle Time for Program
- Median Handling Time
- Mean Handling Time
- Sustained Takt Time for Program
- Mean Takt Time for Program
Histograms
Charts also show:
- Cycle Time Distribution: histogram showing the distribution of cycle times for the selected program(s)
- Takt Time Distribution: histogram showing the distribution of takt times for the selected program(s)
- Program Handling Time (Takt - Cycle): histogram showing the distribution of program handling times for the selected program(s)

Applicability
Currently, this dashboard is targeted at mass production programs that have a stable cycle and takt time and hundreds of cycles that can be inspected during the time period of interest. It can give inconsistent results for programs during New Product Introduction or when a program only has a handful of cycles during the time period. Arch has planned analytics enhancements that will enable this line to be used on New Product Introduction lines as well.
Comments
0 comments
Please sign in to leave a comment.