The Error Code Drilldown Dashboard lets maintenance engineers efficiently identify recurring errors that may be impacting machine performance and/or indicate that a machine needs to be serviced.
All table columns are sortable by clicking the column header. The column which is currently sorted is marked with an up or down error to indicate the direction of the sort.
Because there are a large number of columns in each table, tables often have a horizontal scroll bar as well as a vertical scroll bar.
Filters
You use these filters to select which errors you want to view:
- Site: Select the site you want to view.
- Area: Select the area(s) you want to view (or "All" for all areas).
- Line: Select the line(s) you want to view (or "All" for all lines).
- Error Scope: Choose the machine vendor(s) you want to view (ASM, Fuji, Koh Young, etc.) and the level of detail.
- Specific Errors: Select the errors(s) you want to view (or "All" for all errors).
Remember to use the date picker in the top-right corner to choose the time period you want to view.
Top Errors
The Top Errors table makes it easy for maintenance engineers to identify the highest-priority errors to investigate and resolve. For the selected error(s) and machine(s), you see:
- Namespace: vendor of machine the error occurred on and the selected level of detail
- Code: error code
- Description: additional description of error (if any)
- Global Error ID: Arch globally unique error identifier (preventing confusion between errors with the same name from different vendors)
- Total Duration: For alarms that had been cleared within the selected time period on selected set of machines, the duration of time the errors were active are summed. For instance, if selected duration was "1 day" and there were 2 alarms in the past day that were active for a total of "2 days" and "3 days" respectively, the total duration shows up as "5 days" (2 days + 3 days).
- Max Duration: longest time the error occurred on any machine
- Mean Duration: average time the error occurred on the selected set of machines
- Occurrences: number of times the error occurred

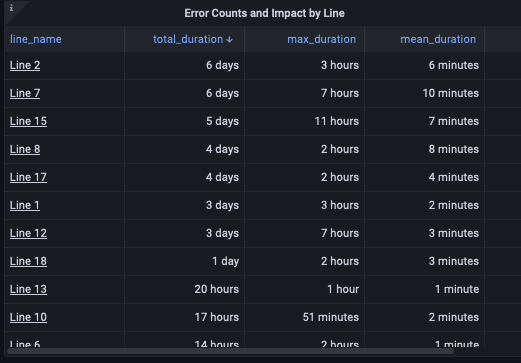
Error Counts and Impact by Line
For the selected error(s) and line(s), you see:
- Line Name
- Total Duration: combined time the error occurred during the selected period on that line
- Max Duration: longest time the error occurred on that line
- Mean Duration: average time the error occurred on that line
- Occurrences: number of times the error occurred

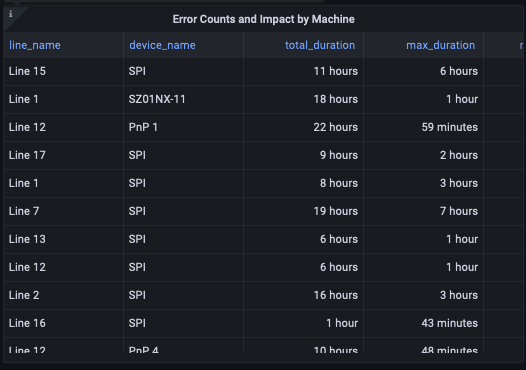
Error Counts and Impact by Machine
For the selected error(s) and line(s), you see:
- Line Name
- Device Name: name of the machines
- Total Duration: combined time the error occurred during the selected period on that line
- Max Duration: longest time the error occurred on that line
- Mean Duration: average time the error occurred on that line
- Occurrences: number of times the error occurred

Table of Errors
For the selected error(s) and line(s), you see:
- Resolved Time: timestamp at which error state ended
-
Line Name: name of the line the error occurred on
- Device Name: name of the machine
- Namespace: vendor of machine the error occurred on and the selected level of detail
- Code: error code
- Msg: additional error message (if any)
- Duration: length of time this instance of the error occurred


Comments
0 comments
Please sign in to leave a comment.