The ICT Yield by Machine Dashboard measures yield across selected machine(s) at a site for selected program(s).
- The Failed Boards Timeline by 5m, Hourly MU (Machine Utilization) Trend, Past 40 Boards timeline, NFF % (No Fault Found %) trend, and NFF Stats panel help identify trends needing attention.
- Program Yield identifies programs needing attention.
- Top Defects per Program helps identify root causes reducing yield.
- No Fault Found Events and Fault Found Events tables enable you to review individual events.
Filters
You use these filters to select which test results you want to view:
- Site: Select the site you want to view.
- Area: Select the area you want to view.
- Line: Select "All" or the specific Line(s) you want to view.
- Machine: Select "All" or the specific Machine(s) you want to view.
- Test Plan: Select "All" or the specific Test Plan(s) you want to view.
Remember to use the date picker in the top-right corner to choose the time period you want to view.
Failed Boards Timeline by 5 minutes (past 3 hours)
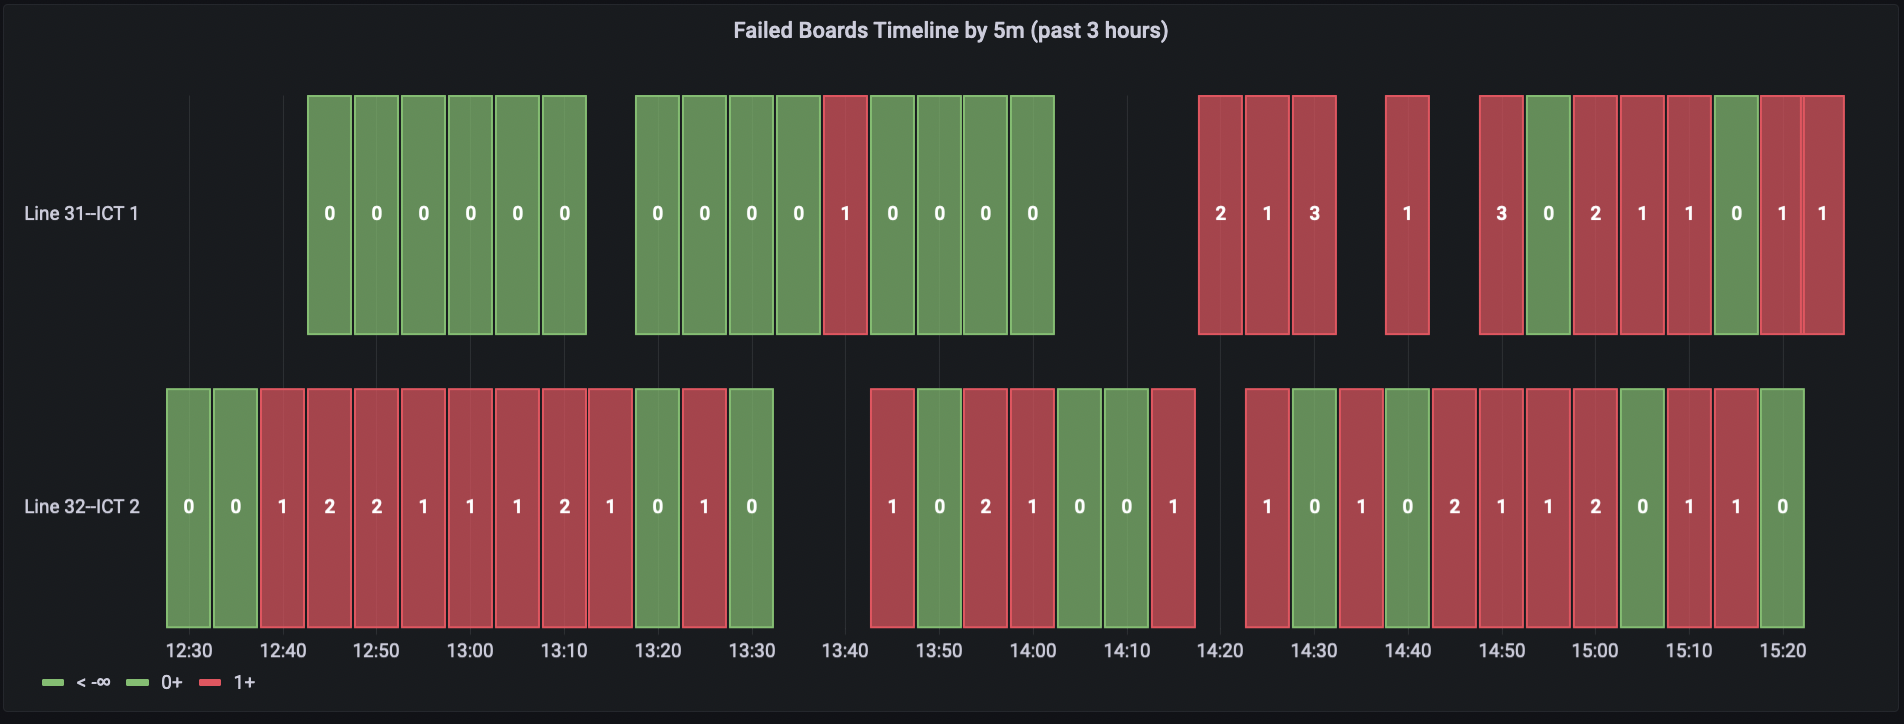
This panel shows the number of failed boards per five minute interval in the past three hours for the selected Machine so that operators and manufacturing engineers can detect trends of increasing error rates that may require attention. Because the panel is intended to provide a granular view of the recent error rate, you cannot change the bucket duration from 5 minutes or the timeline duration from 3 hours.
Hourly MU (Machine Utilization) Trend
Managers can use this trend chart to see if ICT machine utilization is acceptable over the selected period and how it's changing.

ICT machine utilization is defined by the following formula:
MU = [ sum (cycle times) + count(panels)*(10 seconds) ] / (24 hours in each day during selected time period)
The formula assumes a standard 10 seconds to load the ICT for each board.
Hourly MU Trend shows ICT machine utilization over the selected period, hour by hour, according to that formula.
For example, if there were 30 tests that each took 50 seconds during a 1-hour period, MU would be 50% for that hour.
Past 40 Boards
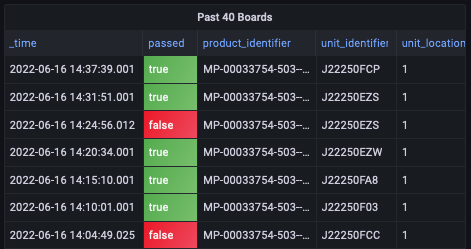
The Past 40 Boards panel shows the timestamp, test result, product identifier, unit identifier, and unit location for each of the last 40 boards tested. Operators can use it to detect when a line is suddenly starting to produce defective products and/or the ICT machine is malfunctioning and needs attention.
Program Yield

For each test program that was run during the period selected, the Program Yield panel shows the Program Name, Total Units, Fails, Passes, and Yield %. Yield % = (Passes / Total) * 100. Line managers can use the panel to assess whether the yield is within target ranges for each program.
Top Defects per Program
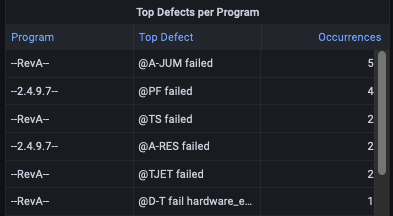
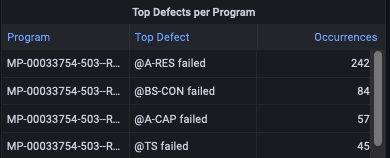
For each program run during the period selected, Top Defects per Program tallies the number of occurrences of each type of error seen by that program. The panel then lists the errors, starting with the error that had the largest number of occurrences on any single program, and showing the error that had the next-most occurrences on any single program, and so on.
When viewing multiple programs, engineers can use Top Defects per Program to identify which errors occur the most frequently and should be addressed first, regardless of program:
When a single program has been selected using the filters, engineers can use the panel to identify the highest-priority errors to address for a specific test program:
No Fault Found Statistics
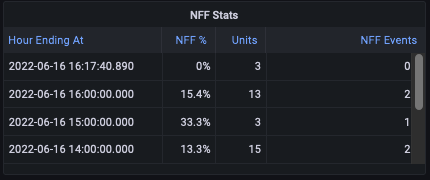
For each hour during the period selected, the No Fault Found Statistics panel shows the number of units that failed inspection, the number of times those were "No Fault Found" events (i.e. the operator overrode the ICT's verdict and determined that the board should pass), and the percentage of failed boards that were passed because no fault was found. If a high percentage of failed boards have no fault found, the test program may require optimization, or there may be problems with the ICT test apparatus itself.
No Fault Found %
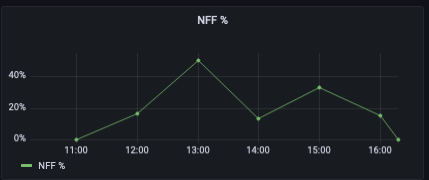
The No Fault Found % chart shows the percentage of no fault found events, hour by hour, over the period selected. Engineers can use it to detect when an increasing no fault found rate suggests that a problem may be occurring. (See What are No Fault Found (NFF) Events and How is NFF % Calculated? to learn more.)
No Fault Found Events
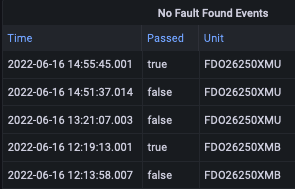
The No Fault Found Events panel shows units that first failed on automated ICT inspection and then passed upon operator manual inspection. In the above screen shot, unit FD026250XMU failed twice on automated ICT inspection and then passed on manual operator inspection, producing a No Fault Found event. Engineers and operators can use this panel to inspect the history of individual No Fault Found events.
Fault Found Events panels
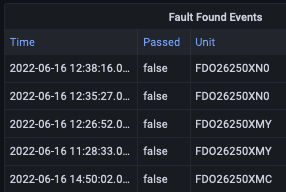
The Fault Found Events panel shows units that first failed on automated ICT inspection and then also failed upon operator manual inspection (i.e. valid fail events). In the above screen shot, unit FD026250XN0 failed on automated ICT inspection and also failed on manual operator inspection, producing a Fault Found event. Engineers and operators can use this panel to inspect the history of valid Fault Found events.

Comments
0 comments
Please sign in to leave a comment.