
The Inspection Defects Trends (ICT) Dashboard shows defect trends at the level of a selected In-Circuit Test machine. You can further filter defect trend information by Program(s) and Defect Type(s) of interest.
Filters
You use these filters to select which test results you want to view:
- Site: Select the site you want to view.
- Area: Select the area you want to view.
- Line: Select the Line you want to view.
- Machine: Select the Machine you want to view.
- Program: Select the Program(s) you want to view (or "All" for all Programs).
- Defect Types for Drilldown: Select the Defect Type(s) you want to view (or "All" for all Defect Types).
Remember to use the date picker in the top-right corner to choose the time period you want to view.
Defect Pareto by Type
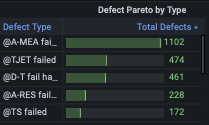
The "Defect Pareto by Type" panel shows the number of defects of each Defect Type during the selected time period according to the current filter selection. If you only want to see defects for a particular Program, use the Program filter. You can also use the "Defect Types for Drilldown" filter to further restrict the Defect Types that are listed.
Defect Timeline by Type
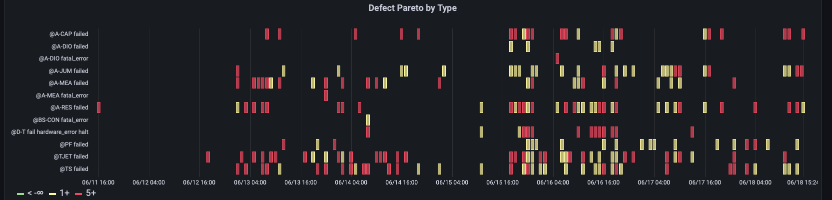
The Defect Timeline by Type timeline shows the number of failures of each Defect Type, in one-hour increments, during the selected time period according to the current filter selection. If you only want to see defects for a particular Program, use the Program filter. You can also use the "Defect Types for Drilldown" filter to further restrict the Defect Types that are listed.
NFF (No Fault Found) Events vs Passed Boards
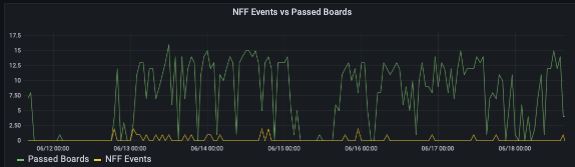
The NFF Events vs Passed Boards panel charts passed boards and No Fault Found events. If No Fault Found events are accounting for an increasing share of passed boards, you may need to check your test setup. (See What are No Fault Found (NFF) Events and How is NFF % Calculated? to learn more.)
NFF Trend by Hour
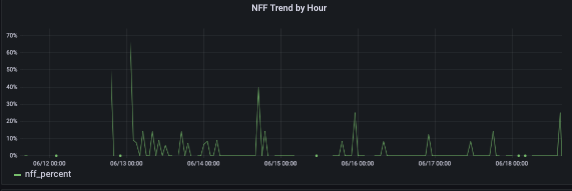
No Fault Found Trend by Hour shows the percentage of failed boards each hour that were ruled No Fault Found by the operator. If the percentage of No Fault Found results is growing, ou may need to check your test setup.
Aggregated Defects by Program and Defect Type
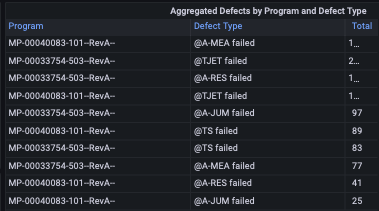
This panel shows each combination of Program name and Defect Type seen during the time period selected and shows the number of defects seen for that combination. If you only want to see defects for a particular Program, use the Program filter. You can also use the "Defect Types for Drilldown" filter to further restrict the Defect Types that are listed. (There is currently a known issue in which sometimes the rightmost characters in the rightmost column are cut off.)
Defects by Unit Location
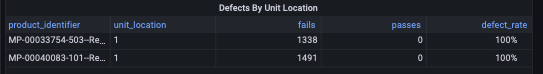
This panel lists each unit location seen for each program, the number of fails and passes at that location, and the calculated defect rate. Defect Rate % = Fails / Total Tests * 100. (There is currently a known issue in the tabulation of passes and the calculation of defect rate, as shown above.)
Defects by Unit Location and Defect Type
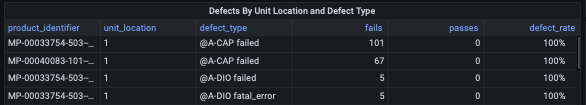
This panel lists each defect type seen at each unit location for each program, the number of fails and passes at that location, and the defect rate. Defect Rate % = Fails / Total Tests * 100. (There is currently a known issue in the tabulation of passes and the calculation of defect rate, as shown above.)
Defects by Defect Location
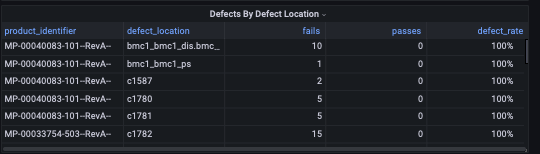
This panel lists each defect type seen at each defect location for each program, the number of fails and passes at that location, and the defect rate. Defect Rate % = Fails / Total Tests * 100. (There is currently a known issue in the tabulation of passes and the calculation of defect rate, as shown above.)
Comments
0 comments
Please sign in to leave a comment.