The Inspection Results Details (ICT) Dashboard shows summary defect information at the level of a selected In-Circuit Test machine.
Filters
You use these filters to select which test results you want to view:
- Site: Select the site you want to view.
- Area: Select the area you want to view.
- Line: Select the Line you want to view.
- Machine: Select the Machine(s) you want to view (or "All" for all Machines).
- Program: Select the Program(s) you want to view (or "All" for all Programs).
Remember to use the date picker in the top-right corner to choose the time period you want to view.
Overview
Pass/Fail Statistics
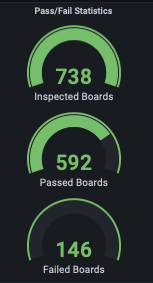
The following values are all "raw totals" without any correction for retesting. If a board is inspected multiple times, it will be counted multiple times.
- "Inspected Boards" shows the raw total number of boards inspected.
- "Passed Boards" shows the raw total number of boards that passed.
- "Passed Boards" shows the raw total number of boards that passed.
Retests
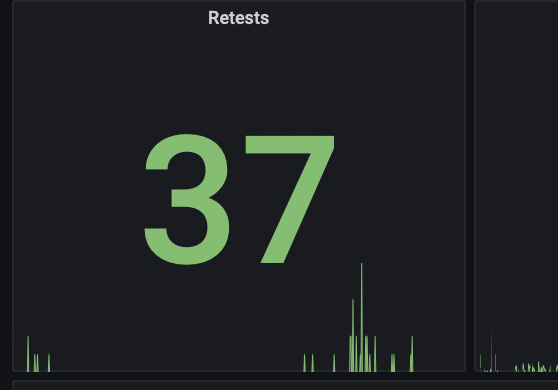
This panel shows the retest count.
Panel Counts
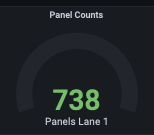
For each Lane present on the Line, a "Panels Lane N" will display the raw number of Panels counted on that Lane. If a panel is tested multiple times, it will be counted multiple times.
Panels with at Least 1 Failed Board
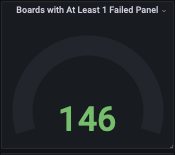
This panel shows the number of Panels on which at least one Board was failed. If a Panel is tested multiple times and fails multiple times, it will be counted multiple times.
True Defects
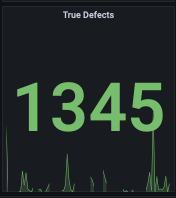
This panel shows the number of valid defect reports that were not overruled as "No Fault Found" by the ICT operator.
For understanding the difference between panel and board, refer to help documentation on "What do board and panel mean within Arch Product user interfaces".
Inspection timelines: Panels Inspected, Boards Inspected, Defects Found, Median Takt Time Lane 1, Median Takt Time Lane 2
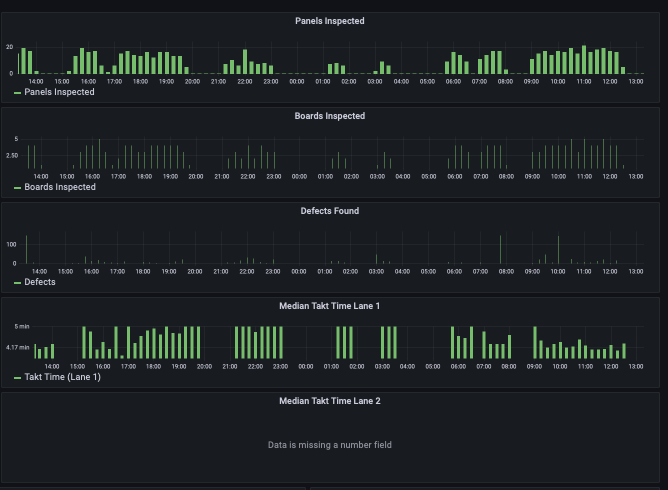
All of these timelines show statistics in 15-minute increments over the period selected. They all show raw, uncorrected totals. If a unit is tested multiple times, it will be counted multiple times.
Takt Time measures the time period between "product ready" events.
If only a single Lane is present, "Median Takt Time Lane 2" will show "Data is missing a number field" since the query result will be empty.
Inspection Performance

The Inspection Performance panel shows a history of the performance statistics for individual inspection events. For each, the timestamp, Machine, Program, Lane, Cycle Time, Takt Time for Lane 1, and Takt Time for Lane 2 are shown. If an ICT machine is configured for single-lane operation, "Takt Time Lane 1" and "Takt Time Lane 2" will show the same value.
Inspection Results

The Inspection Results panel shows a history of the pass/fail results for individual inspection events. For each inspection event, the timestamp, Machine, Program, Unit identifier, Unit Location, and Passed result (true for pass, false for fail) are shown.
If a board is tested multiple times, multiple entries will be shown for the board.
Program Mean Cycle Time

For each program seen during the period selected, the Program Mean Cycle Time panel shows the mean cycle time (from start of work to end of work, excluding loading time) for the inspection events.
Defects per Program

For each program seen during the period selected, the Defects per Program panel shows the total number of defects observed. If a board is tested multiple times, its defects will be counted multiple times.
Program Yield

For each program seen during the period selected, the Program Yield panel shows the total number of defects observed. Fails, Passes, and Total are simple sums without de-duplication for retests. Yield = Passes / Total * 100. If a board is tested multiple times, its results will be counted multiple times.
Defect Details

The "Defect Details" panel lists each defect seen during the period selected according to the current filter selection. For each, timestamp, Defect Type, test Program name, Unit ID, Unit Location, and Reference Design are shown.

Comments
0 comments
Please sign in to leave a comment.