The ICT Yield Overview Dashboard measures yield across selected machine(s) at a site for selected program(s). It serves as a starting point for engineers and operators to identify problems of concern that they can drill down on using the other ICT dashboards.
- The Failed Boards Timeline by 5m, NFF % (No Fault Found %) Per Hour, and NFF Counts per Hour panels help identify trends needing attention.
- Machine Summary shows the most common single error found by any program on each machine, and the program the error was detected on
- Top Defects per Program helps identify root causes reducing yield.
- Program Yield identifies programs needing attention.
- Total Tests shows the number of tests performed per hour during the selected time period.
Filters
You use these filters to select which test results you want to view:
- Site: Select the site you want to view.
- Area: Select the area you want to view.
- Line: Select "All" or the specific Line(s) you want to view.
- Machine: Select "All" or the specific Machine(s) you want to view.
- Test Plan: Select "All" or the specific Test Plan(s) you want to view.
Remember to use the date picker in the top-right corner to choose the time period you want to view.
Failed Boards Timeline by 5 minutes (past 3 hours)
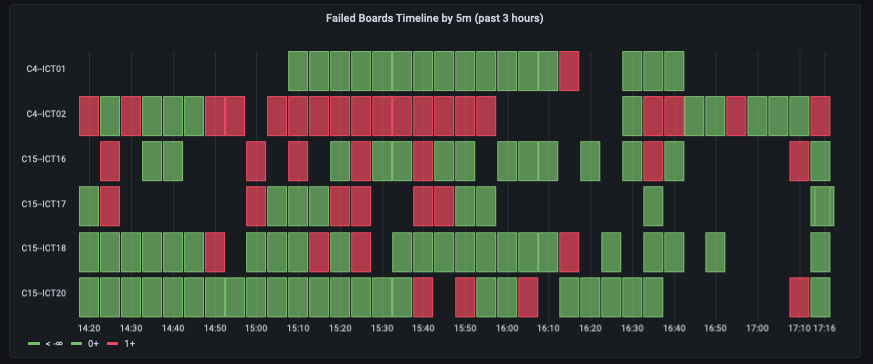
This panel shows the number of failed boards per five minute interval in the past three hours for the selected Machine(s) so that operators and manufacturing engineers can detect trends of increasing error rates that may require attention. Because the panel is intended to provide a granular view of the recent error rate, you cannot change the bucket duration from 5 minutes or the timeline duration from 3 hours.
Machine Summary

For each selected Machine, this panel shows the Top Defective Program (Test Plan with largest number of a single kind of defect) and the name of the Top Defect (the most common defect found on that Machine by that program).
For the listed defect listed it shows the number of Defect Occurrences.
For each Machine, it also shows:
- Failed Boards
- Passed Boards
- Total Boards
- Yield %
NFF % per Hour
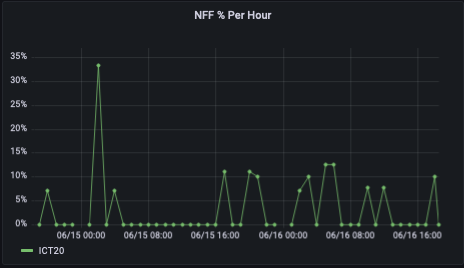
This panel shows the percentage of "failed" tests that were actually No Fault Found events per hour on each machine selected using the filters. (See What are No Fault Found (NFF) Events and How is NFF % Calculated? to learn more.)
NFF Counts per Hour
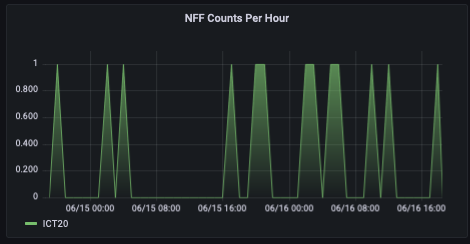
This panel shows the number of No Fault Found events per hour on each machine selected using the filters.
Total Tests
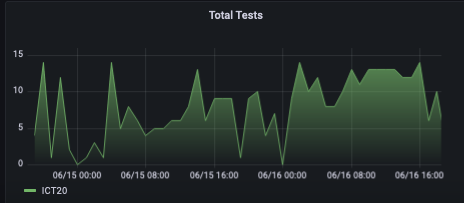
This panel shows the total number of tests run per hour on each machine selected using the filters.
Top Defects per Program
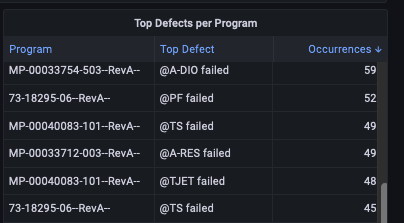
For each program run during the period on the selected set of area, line(s), machine(s) and program(s), Top Defects per Program tallies the number of occurrences of each type of error seen by each program. The panel then lists the errors, starting with the error that had the largest number of occurrences on any single program, and showing the error that had the next-most occurrences on any single program, and so on.
When viewing multiple programs, engineers can use Top Defects per Program to identify which errors occur the most frequently and should be addressed first, regardless of program. When a single program has been selected using the filters, engineers can use the panel to identify the highest-priority errors to address for a specific test program.
Program Yield
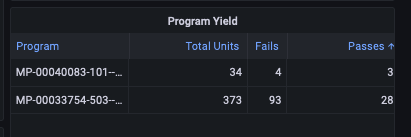
For each test program that was run during the period selected, the Program Yield panel shows the Program Name, Total Units, Fails, Passes, and Yield %. Yield % = (Passes / Total) * 100. Line managers can use the panel to assess whether the yield is within target ranges for each program.

Comments
0 comments
Please sign in to leave a comment.