The "Top Worst Nozzle Monitoring - timeline view" Dashboard lets you quickly identify the nozzles at a site, on a line, and/or on a machine that have the largest number of mispicks. This helps maintenance engineers identify nozzles that may need to be serviced.
Filters
You use these filters to select which nozzles you want to view:
- Site: Select the site you want to view.
- Error Scope: Choose the machine vendor you want to view (ASM, Fuji, etc.).
- Line: Select the line you want to view (or "All" for all lines).
- Machine: Select the machine you want to view (or "All" for all machines).
- Bucket: Specify the duration of each point on the trend chart (see below) and each band on the heat map (see below). For example, if you set Bucket to 1 hour and view 12 hours of data, you'll see 12 points on the trend chart representing one hour each, and you'll see 12 bands in the heat map, each one hour long.
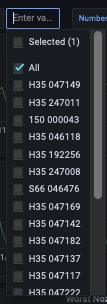
- Worst Nozzles: For vendors with serialized nozzles such as Fuji, lets you choose to view All nozzles or a set of one or more nozzles of your choosing (using the multi-select checkboxes on the pulldown menu).
- Number of Nozzles: Choose how many nozzles you want listed on the timeline (see below).
Remember to use the date picker in the top-right corner to choose the time period you want to view.
Statistics and timelines
After setting your filters, you will see:
- Total Placements
- Total Attrition
- Total Placements by Line (as a timeline)
- Total Mispicks by Line (as a timeline)
- Worst Nozzle Mispicks (as a timeline)
... for the selected site and line(s). Each nozzle is shown in a different color on the "Worst Nozzle Mispicks" timeline:

Choosing individual nozzles to view
You can use the Worst Nozzles pulldown menu to choose which combination of the nozzles you want to view:

Viewing details on a single data point
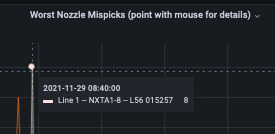
You can mouse over any of the points on the Worst Nozzle Mispicks timeline and see detailed information about that data point:


Comments
0 comments
Please sign in to leave a comment.