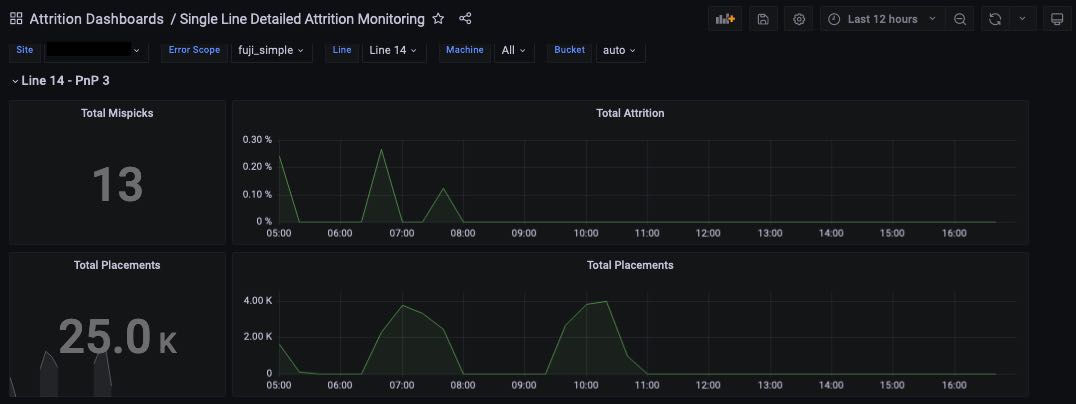
The Single Line Detailed Attrition Monitoring Dashboard let maintenance engineers efficiently identify sources of attrition on a single line.
Filters
You use these filters to select which nozzles you want to view:
- Site: Select the site you want to view.
- Error Scope: Choose the machine vendor you want to view (ASM, Fuji, etc.) and whether you want simple or detailed error reporting. "Simple" view will aggregate errors into groups like missed_pickup, reject, machine_reject, or no_pickup; "detailed" view will show each error code individually.
- Line: Select the line you want to view.
- Machine: Select the machine(s) you want to view (or "All" for all machines).
- Bucket: Specify the duration of each band on the heat map (see below). For example, if you set Bucket to 1 hour and view 12 hours of data, you'll see 12 bands in the heat map, and each band will be one hour long.
Remember to use the date picker in the top-right corner to choose the time period you want to view.
Line summary statistics
After setting your filters, for the selected site and line, you see:
- Total Mispicks
- Total Attrition (as a timeline)
- Total Placements
- Total Placements (as a timeline)

Mispick Reasons and Feeder Locations
- The Mispick Reasons table shows you mispick reasons aggregated by category (if "Error Scope" is "simple") or by individual error code (if "Error Scope" is "detailed").
- The Feeder Locations heatmap shows each feeder as a bar and the number of mispicks per bucket by color codes. Hover over a bucket to see detailed information about it.

Mispicks by Segment/Holder and Errors by Nozzle Holder/Segment
- The Mispicks by Segment/Holder table shows mispicks broken down by Head/Gantry and Segment/Holder.
- Errors by Nozzle Holder/Segment shows each nozzle holder as a bar and uses color coding to show the number of errors that occurred during each time bucket. Hover over a bucket to see details.


Comments
0 comments
Please sign in to leave a comment.