
The Detailed Nozzle Attrition (Fuji) Dashboard lets maintenance engineers efficiently identify nozzles needing service on a line or machine on Fuji P&P machines.
Filters
You use these filters to select which nozzles you want to view:
- Site: Select the site you want to view.
- Error Scope: Choose whether you want the simple or detailed views. "Simple" view will aggregate errors into groups like missed_pickup, reject, or no_pickup; "detailed" view will show each error code individually.
- Line: Select the line you want to view (or "All" for all lines).
- Machine: Select the machine you want to view (or "All" for all machines).
- Bucket: Set the duration of each bar on the heat maps (see below).
Remember to use the date picker in the top-right corner to choose the time period you want to view.
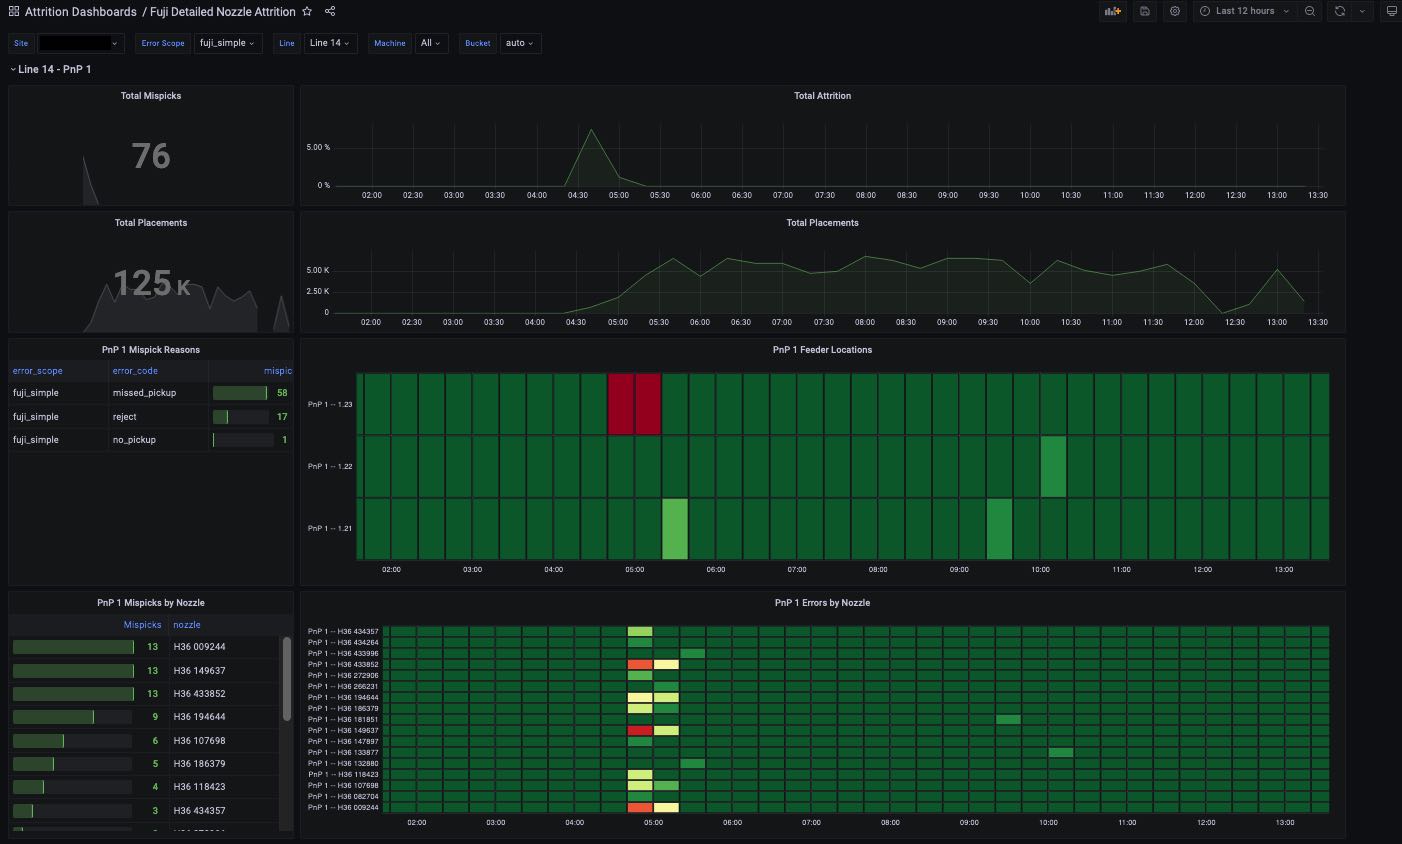
Per-P&P statistics
After setting your filters, you will see the following data for each selected machine on the selected site and line:
- Total Mispicks
- Total Placements
- Total Attrition (as a timeline)
- Total Placements (as a timeline)
- Mispick Reasons, with error categories or codes and the quantity for each
- Feeder Locations (as a heatmap), showing in color code the number of errors for each feeder in each "bucket" (time period); you can hover over a bucket to see details
- Mispicks by Nozzle, identifying each nozzle by serial number and showing how many mispicks it had
- Errors by Nozzle (as a heatmap), showing in color code the number of errors for each nozzle in each "bucket" (time period); you can hover over a bucket to see details
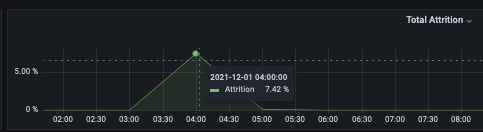
Hover over point on timeline to see details
If you hover over a point on the timeline, you can see details about that event:
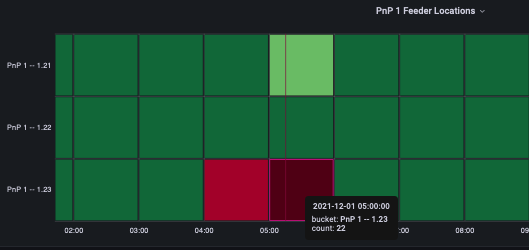
Hover over bucket to see details
If you hover over a bucket on the heatmap, you can see details about that time period on the feeder or nozzle:
Comments
0 comments
Please sign in to leave a comment.